
Lazy JIT and GC under application load
Development measurements — 26 and 28 October 2026. Lazy JIT lowers and compiles a method when first called, leaving unused bodies uncompiled. The intended direction is lazy JIT with concurrent GC where it benefits a broad range of applications. The measurements below identify where it helps and which costs need optimization. Eager JIT and synchronous GC remain the defaults in the current implementation.
Shared startup optimization follow-up
Native selection and generic expansion reuse temporary immutable metadata indexes, selected-body scans run once per dispatch pass, and successful interface inheritance lists are now reused within bounded immutable scopes. The updated paired HTTP table reports the latest incremental comparison: modest, variable startup gains, with mixed short-run throughput. A longer eager/sync check does not reproduce its short-run throughput regression. No warm-throughput gain is claimed. First-call waits remain. The latest cohort leaves 811 methods uncompiled; the earlier placement/load cohort below used different inputs and left 729. Independent cohorts are not pooled.
Startup and warm execution
On Apple M1, three-round JSON-server medians show earlier readiness with lazy JIT, but work moves into the first request. The complete HTTP table also includes plaintext, while execution benchmarks show small-program startup, where changes are mixed.
| JSON server / GC | Eager ready | Lazy ready | Lazy first response | Eager warm req/s | Lazy warm req/s |
|---|---|---|---|---|---|
| Sync | 12.80 s | 9.95 s | 1.70 s | 1,936 | 2,123 |
| Concurrent | 15.52 s | 10.32 s | 3.08 s | 1,713 | 1,477 |
These runs use production-default backend optimization. Eager uses system code
placement; lazy uses a bounded arena on macOS ARM64. Separate paired placement
controls improve lazy throughput by 22–30% in median comparisons. The JSON case
compiles 870 of 1,599 selected methods, leaving 729 uncompiled. Earlier speed
experiments are a separate series, not additional samples in these medians.
Complex handlers and downstream I/O
The handler parses and serializes nested JSON, creates temporary records, performs checked calculations and maintains a 4,096-object live window. The service variant also awaits a checked local socket operation with a 20 ms response delay. This models downstream waiting; it is not a database benchmark.
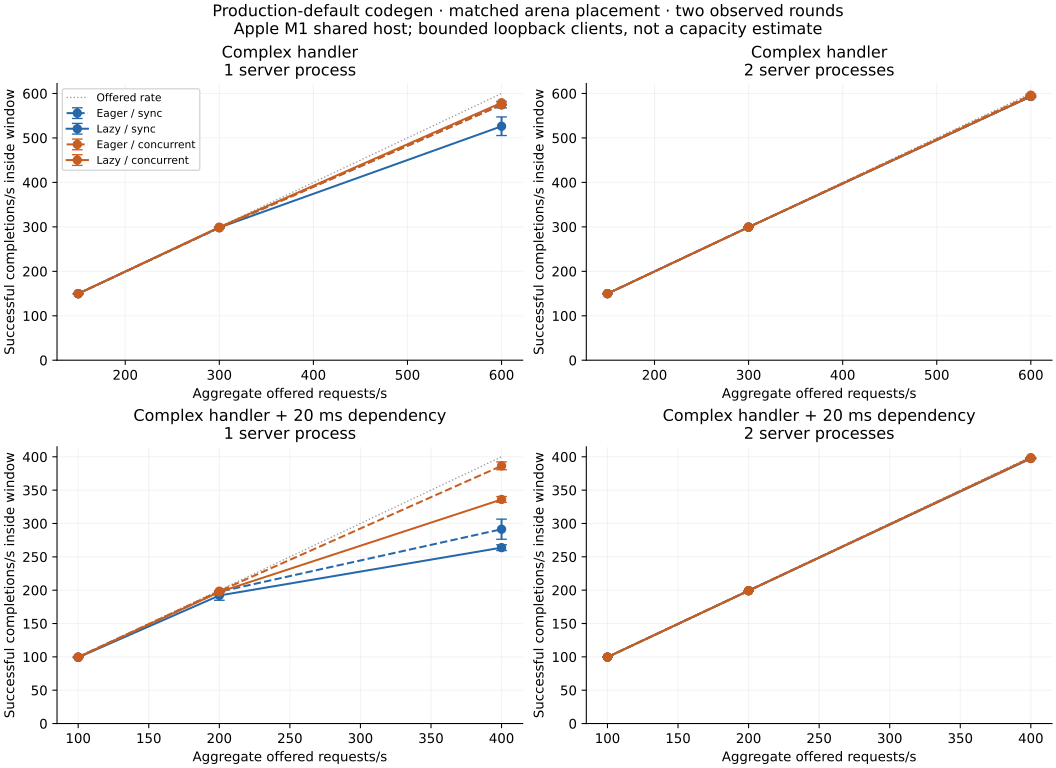
The following table compares lazy JIT with matched arena placement. Values are two-round medians. Throughput counts successful responses inside the offered-load window. CPU is aggregate server CPU during traffic and drain; latency includes client dispatch delay. A two-app case uses separate processes sharing the host.
| Case | Apps / offered req/s | Sync completed/s | Concurrent completed/s | Sync / concurrent p99 | Sync / concurrent CPU |
|---|---|---|---|---|---|
| Complex handler, delayed headers | 1 / 600 | 526.3 | 579.2 | 111 / 101 ms | 9.75 / 10.44 s |
| Downstream I/O, delayed headers | 1 / 400 | 263.8 | 336.0 | 200 / 116 ms | 7.98 / 9.97 s |
| Downstream I/O, delayed headers | 2 / 400 | 397.4 | 398.3 | 107 / 51 ms | 13.13 / 18.62 s |
| Uneven compute traffic, 90/10 split | 2 / 300 | 299.4 | 298.7 | 27 / 90 ms | 8.89 / 14.16 s |
| Ordinary complex requests | 1 / 600 | 567.0 | 587.7 | 98 / 67 ms | 14.47 / 15.87 s |
| Ordinary requests + downstream I/O | 1 / 400 | 292.5 | 360.4 | 152 / 95 ms | 12.17 / 14.68 s |
The first four rows use 10-second windows and a deliberate 20 ms header gap to exercise pending reads. The last two use 15-second windows and send the complete request together. Compare CPU within a row, not across different durations.
At two apps and 400 req/s, lazy concurrent passes both rounds of the provisional 100 ms p99 / zero-loss / low-generator-lag target; lazy sync does not. Concurrent uses about 42% more CPU. At the uneven 300 req/s point, lazy sync passes both rounds and concurrent does not. The high-rate one-app rows lose arrivals under both collectors; their throughput is not a qualified capacity. The ordinary compute throughput direction reverses between rounds, so its median is not a consistent concurrent win. Eager sync also passes the two-app I/O point.
Cold traffic remains the important weakness
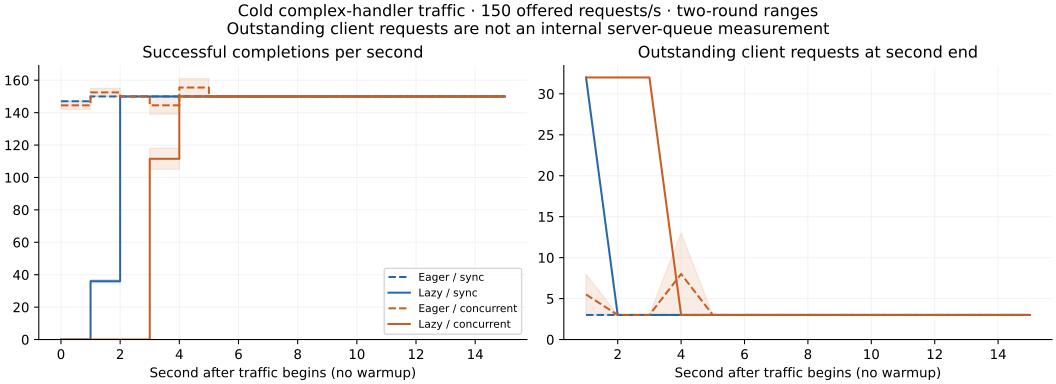
At 150 offered requests/s with no warmup, concurrent-lazy completes no successful responses during the first three seconds. Both rounds time out the first 32 requests at the three-second client deadline. Over the full 15-second windows, eventual success is 78.42% for lazy concurrent, 88.40% for lazy sync and 100% for both eager controls. Traffic starts after readiness; launch time is measured separately.
The compiler worker currently blocks the sole managed execution thread on first use. Safely suspending the cold caller could let unrelated warm handlers progress. Faster compilation or a fast initial execution tier is needed to shorten the cold call itself. Neither approach requires compiling every unused method.
What this directs us to optimize
Shared metadata lookup/preparation and warm frame/TLS work can benefit multiple execution and GC modes. Lazy concurrent additionally has conservative store checks and first-call scheduling costs. These measured costs guide the next changes; more benchmark cases are useful only when they answer a specific question.
The goal is broad workload usefulness, not a single benchmark winner. Concurrent GC has useful I/O/latency opportunities; sync remains attractive when its lower CPU cost matters. Extra optimization headroom is not a promised future speedup.
Measurement scope and benchmark review
These are controlled development fixtures on one Apple M1/macOS host with 16 GiB RAM, production-default codegen and explicit native/collector recipes. The client and dependency share the host; load cases request connection close; background desktop activity and some high generator lag limit attribution. There are no hard per-app CPU/memory quotas. Two rounds show observed variability, not confidence intervals or production capacity. Successful-request p99 excludes missed arrivals and timeouts; losses remain in the offered denominator and the full tables. Profiles run separately from timings.
The benchmark review retains simple regression tests but calls for real database and pool pressure, mixed warm/cold routes, longer overload/recovery runs and a separate load host before capacity claims. TechEmpower's preserved workload specifications are useful references; these fixtures are not compliant submissions or comparisons with its published rankings.
All load points and ranges · Raw evidence, profiles and reproduction · Workload and TechEmpower review · How other runtimes handle lazy compilation