
Garbage collector benchmarks
GC work targets general runtime workloads as well as HTTP. Recent changes remove repeated heap walks during allocation and host-handle admission while preserving complete validation. Earlier series measure object graphs, roots and scheduler waits.
These are development measurements, not release guarantees. See HTTP benchmarks for application results and garbage collection for the runtime model. Each historical series retains its own conditions and raw evidence.
Current collector comparison — 2026-10-25
Development candidate, Apple M1, 8 logical CPUs, 16 GiB RAM, macOS ARM64. Our intention is to make concurrent GC the general-purpose default, with better overall application performance. Sync remains the current default and a useful option for small, resource-constrained devices. These measurements do not yet establish a general concurrent advantage.
Each collector keeps its own result history. Cross-collector runs use the same application inputs, while allowing different policies. Here sync uses allocation / publication budgets 256/4096; concurrent uses 1024/16384 and a 50% mutation-log watermark. Both use a 1 MiB arena; the concurrent log has 4096 words.
Plain HTTP and HTTP JSON
5 alternating rounds, four clients, 4,096 measured requests plus 16 warmups per run, HTTP loopback with connection close and checked response bodies/EOF. CPU includes the server process and collector worker through shutdown. These are AOT experiments, separate from published-package and cross-framework results.
| Sample | Collector | Median requests/s | Process CPU µs/response | Peak arena bytes |
|---|---|---|---|---|
| Plain text | Sync | 5,139 | 194.8 | 99,280 |
| Plain text | Concurrent | 4,076 | 249.0 | 309,768 |
| JSON | Sync | 3,130 | 316.4 | 101,248 |
| JSON | Concurrent | 2,730 | 370.1 | 353,408 |
Concurrent-specific tuning previously improved plain/JSON throughput by about 13%/17% with lower CPU, at the cost of more arena space. Log-pressure completion removes observed store cancellations. These are gains against earlier concurrent settings; sync remains ahead in the paired table above.
Applications with different allocation patterns
The same non-HTTP sources run under both collectors. Each prints a checked checksum. Different rows have different work counts: compare collectors within a row. Invocation CPU excludes process startup and compilation, includes cleanup and collector threads. 5 alternating rounds; allocation counts match across modes.
| Sample | Managed allocations | Sync CPU ms | Concurrent CPU ms | Concurrent / sync CPU |
|---|---|---|---|---|
| Compute only | 13 | 62.07 | 62.11 | 1.00× |
| Reusable buffer | 14 | 17.43 | 104.81 | 6.01× |
| Steady allocation | 1,048,589 | 96.16 | 161.90 | 1.68× |
| Allocation bursts | 524,301 | 53.50 | 85.91 | 1.61× |
| Retained window | 1,049,615 | 218.27 | 346.48 | 1.59× |
| Mixed phases | 1,048,589 | 107.66 | 166.87 | 1.55× |
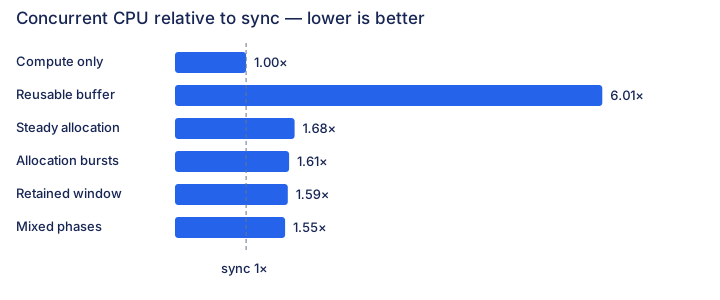
The reusable-buffer case allocates only 14 managed objects and completes no concurrent collection cycle, yet its CPU cost is much higher. That points toward runtime store/barrier work rather than repeated collection. Compute-only work is approximately equal. Allocation-heavy and retained-object cases still cost more with concurrent GC. These cases guide the next improvements; the default will not change merely because HTTP tuning improved.
Benchmark and profile runs remain separate. Diagnostic runs capture owner pauses, begin/capture, marker, finish and collection-phase costs. No instrumented timing is used as a throughput improvement. The suite records build inputs and policies; self-comparison rejects mismatched workloads, hardware or diagnostic runs.
Standard samples and procedure · Raw reports and interpretation · Concurrent tuning and worker evidence
Direct leaf marking — 2026-10-14
Text and byte buffers contain no references. The native collector now marks them without adding empty tracing work to its queue. Dependent-owner iteration still runs to completion, including chains whose owners are themselves leaf buffers.
On macOS ARM64, five alternating collection-only pairs show 12.2% higher throughput for 64 large atomic buffers. Most reference-graph controls stay within about 1.1%; one chain case improves 5.6%. All 35 shared GC/root checks pass. Matched short AOT HTTP runs improve 4.7% plain / 4.8% JSON, with unchanged allocation counts and full reclamation in separate profiles. These stress-GC results do not establish sustained-load or Windows performance. Method, tradeoffs and raw evidence.
Host-handle admission — 2026-10-13
Creating a native host root formerly validated the heap, then searched it again for the referenced object and owner. One walk now does both. It still validates every trailing header before registering the root, even when the objects are found early. This helps native lifetime integration without changing collection policy.
Local macOS ARM64, five alternating pairs after warmup; baseline/candidate elapsed time ratios. Each timed operation creates, reads and releases one root. Heap construction and final reclamation are excluded.
| Case | 16 objects | 256 objects | 4,096 objects |
|---|---|---|---|
| Strong root, first object | 1.00× | 1.03× | 1.00× |
| Strong root, last object | 1.13× | 1.77× | 1.76× |
| Owner and value first | 1.03× | 1.00× | 1.00× |
| Owner last, value first | 1.06× | 1.90× | 1.87× |
| Owner last, value middle | 1.21× | 2.22× | 2.22× |
| Owner and value last | 1.40× | 2.59× | 2.57× |
Early-object controls remain near baseline; later objects benefit from fewer heap walks. A separate AOT HTTP comparison passes 768 responses with plain/JSON medians within 0.3% of baseline. This is not an HTTP throughput improvement. Protocol, raw rounds and correctness checks.
Hosted macOS/Windows GC, socket and native-package checks pass. At 256/4,096 objects, later-entry gains are 1.56–2.60× on hosted macOS and 1.43–2.26× on Windows. Windows early-entry controls are 0.974–1.004×; hosted macOS controls are 0.882–1.110×, including slower medians with overlapping ranges. All rounds remain in the linked record. These are within-host comparisons, not a platform ranking or a universal non-regression guarantee. Windows ARM64 remains unmeasured.
Allocation throughput — 2026-10-13
Allocation formerly walked heap headers once for validation, then again to find free space. It now selects the first suitable hole during the validation walk. Every header is still checked before the heap changes, including headers after a usable hole. Failure outputs, corruption detection and collection policy remain.
The table shows baseline/candidate elapsed-time ratios from five alternating pairs after warmup. Construction of fragmented heaps and final collection are outside timing. Each column is a separate paired run, not a platform ranking.
| Workload | Allocations per batch | Local macOS ARM64 | Hosted macOS ARM64 | Windows x64 |
|---|---|---|---|---|
| Objects | 64 | 1.66× | 1.37× | 1.37× |
| Objects | 1,024 | 1.88× | 1.32× | 1.70× |
| Objects | 4,096 | 1.89× | 1.60× | 1.82× |
| String-sized blocks | 1,024 | 1.87× | 1.34× | 1.84× |
| Byte buffers | 256 | 1.52× | 1.58× | 1.39× |
| Fragmented refill | 1,024 | 1.49× | 1.18× | 1.32× |
String-sized blocks are 128-byte atomic allocations; this does not measure encoding or string API throughput. Object payloads are 16 bytes and buffers 8,192 bytes. All workers check retained contents and final reclamation. Full validation is still linear per allocation, so this does not establish constant-time allocation. Protocol and all raw rounds.
Experimental follow-up: collection pacing
A separate closed native workload protects every allocation with rooted admission. Its local object/string runs are 3.98×/3.57× faster with less frequent collection, while peak arena extent rises about 23%. The pressure counterexample that rejected the previous reserve-based policy now passes, alongside cleanup and suspended-owner checks. This is not enabled for general managed or HTTP execution. Remaining helper-root coverage and real scheduler idle integration are required first. Experimental evidence and limitations.
Dense object graphs — 2026-10-13
The native collector now uses a denser address index above 2,048 heap spans. This reduces repeated block-header searches while keeping exact payload checks, root ownership and collection frequency unchanged. The extra index costs 32 KiB of temporary native stack and one additional validated heap walk on the dense path.
Initial local candidate: macOS ARM64, Xcode Clang -O2; five alternating pairs after warmup.
Values below are milliseconds per full collection: median (observed minimum–maximum).
Graph construction and final reclamation are outside the timed interval.
| Shape | Live objects | Baseline ms | Adaptive ms | Ratio |
|---|---|---|---|---|
| Chain | 64 | 0.0008 (0.0008–0.0015) | 0.0008 (0.0008–0.0012) | 1.01× |
| Chain | 1,024 | 0.0155 (0.0154–0.0163) | 0.0155 (0.0155–0.0155) | 1.00× |
| Chain | 2,048 | 0.0397 (0.0397–0.0397) | 0.0396 (0.0396–0.0398) | 1.00× |
| Chain | 2,049 | 0.0398 (0.0398–0.0433) | 0.0295 (0.0294–0.0320) | 1.35× |
| Chain | 4,096 | 0.1178 (0.1177–0.1185) | 0.0622 (0.0621–0.0656) | 1.89× |
| Chain | 16,384 | 1.3975 (1.3513–1.3992) | 0.3137 (0.3036–0.3324) | 4.46× |
| Wide | 16,384 | 1.2973 (1.2179–2.0204) | 0.2475 (0.2323–0.4342) | 5.24× |
| Holes | 4,096 | 0.2199 (0.2197–0.2200) | 0.1017 (0.1011–0.1025) | 2.16× |
| Atomic | 64 | 0.0006 (0.0006–0.0006) | 0.0007 (0.0007–0.0007) | 0.98× |
The 16,384-object chain and wide graph collect 4.46× and 5.24× faster. Separate diagnostic runs reduce chain lookup-header visits from 70.7 million to 5.2 million over 100 collections. Small/sparse controls remain near baseline; their slight changes are not evidence of a gain. All workers verify their live graphs and complete final reclamation.
This is a collection-only test of the shared JIT/AOT native collector. It does not measure allocation throughput, interpreter GC, concurrent load or parity with .NET/Go. A separate local HTTP regression comparison passes all 1,536 responses: plain/JSON JIT/AOT median throughput stays within 2% of baseline, with overlapping ranges. The graph improvement does not translate into a material HTTP gain here.
Raw graph rounds and methodology and costs. The final bookkeeping refinement also passes hosted macOS/Windows GC and socket contracts. Its large-chain/wide speedups are 4.48×/4.90× on macOS ARM64 and 4.63×/5.19× on Windows x64. These are within-machine comparisons, not platform rankings. Final Windows small-control costs are under 2%; hosted macOS short controls include up to a 12.5% slowdown. Longer local controls cost roughly 0.3–1.5%. The benchmark record retains all rounds: the dense-graph gain does not promise improvement for every workload. Final evidence and limitations.
Windows GC versus waits — 2026-10-13
Same guest objects and runtime sources, with a build switch selecting the old sleep policy or the new bounded readiness wait. Windows Server 2022 x64 on one GitHub-hosted AMD VM; five alternating rounds, with ranges shown alongside medians. This is a separate series from the root-observation experiment below.
| Workload | Mode | Sleep requests/s (range) | Readiness requests/s (range) | Median ratio |
|---|---|---|---|---|
| Plain text | JIT | 40.10 (37.07–42.30) | 89.30 (82.63–93.46) | 2.23× |
| Plain text | AOT | 41.77 (37.47–47.44) | 87.19 (58.55–91.94) | 2.09× |
| Object JSON | JIT | 29.95 (26.94–33.21) | 47.36 (45.84–49.51) | 1.58× |
| Object JSON | AOT | 28.45 (25.12–33.21) | 46.73 (46.25–47.74) | 1.64× |
All 1,536 responses passed, including 960 timed requests. Observed ranges do not overlap; the slower plain-text AOT candidate round remains included. The short, sequential protocol measures neither saturation nor parity with .NET or Go. Immutable raw run.
Separate instrumented AOT runs explain the improvement. These are elapsed intervals for the whole process, including warmup and shutdown, not per-request pauses or an exclusive CPU breakdown.
| Measured interval | Plain text, sleep → readiness | JSON, sleep → readiness |
|---|---|---|
| Scheduler waits | 424–443 → 24–27 ms | 386–489 → 51–63 ms |
| Collection | 191–196 → 195–198 ms | 359–361 → 355–356 ms |
| Socket polling | 1.95–2.13 → 1.66–1.77 ms | 2.11–2.20 → 1.79–1.82 ms |
All 256 diagnostic responses passed. Every process reclaimed all its tracked allocations: 16,340 for plain text and 38,358 for JSON, with no GC or scheduler errors. Socket/GC contracts and the HTTP/HTTPS execution checks also pass. The diagnostic record links every raw profile and correctness report.
The Windows host now waits for socket readiness with a requested timeout of at most one millisecond. DNS-only, timer-only and legacy TLS waits retain their fallback; macOS waiting is unchanged. Callbacks still pass through the same scheduler, and GC policy is unchanged. A follow-up needs to investigate collection pressure and complete temporary-root coverage before reducing collections.
Root observation — 2026-10-13
Previously the native host read every published root into a diagnostic accumulator before the collector read it again. The candidate removes that duplicate pass while preserving descriptor validation, roots and every existing collection boundary. Only the root observer differs within each baseline/candidate pair. This change does not reduce allocations or introduce a new collection policy.
Tables show median requests per second, with the minimum–maximum across five alternating rounds in parentheses. Ranges are observations, not confidence intervals.
macOS ARM64
Interactive workstation; fixed guest assemblies and native objects. These fixtures are separate from the newer streaming-library follow-up below.
| Workload | Mode | Baseline requests/s (range) | Candidate requests/s (range) | Median change |
|---|---|---|---|---|
| Plain text | JIT | 64.42 (64.01–66.42) | 86.80 (79.13–88.02) | +34.7% |
| Plain text | AOT | 68.79 (61.59–69.48) | 88.80 (84.72–89.90) | +29.1% |
| Object JSON | JIT | 35.99 (32.89–36.19) | 48.58 (47.24–48.79) | +35.0% |
| Object JSON | AOT | 37.51 (36.54–38.01) | 49.27 (46.03–49.71) | +31.4% |
All 1,536 responses passed validation; 960 requests contributed to measured rounds. Immutable raw results.
Windows x64
Windows Server 2022, GitHub-hosted AMD virtual machine; tested revision 88f522c1c.
The same paired protocol uses freshly built Windows guests. Compare within this
table, not against the macOS host or its guest fixtures.
| Workload | Mode | Baseline requests/s (range) | Candidate requests/s (range) | Median change |
|---|---|---|---|---|
| Plain text | JIT | 25.81 (24.33–29.26) | 26.01 (24.39–27.36) | 0.8% |
| Plain text | AOT | 24.72 (23.63–26.48) | 24.80 (23.17–26.88) | 0.3% |
| Object JSON | JIT | 18.06 (16.41–19.52) | 19.88 (19.40–20.47) | 10.1% |
| Object JSON | AOT | 18.07 (17.29–18.72) | 19.68 (18.65–20.95) | 8.9% |
All 1,536 responses passed validation; 960 requests contributed to measured rounds. Plain-text differences are within variability. JSON medians improved, but ranges overlap: more evidence is needed to establish the size and consistency of the gain. Immutable raw results · Windows execution. Windows ARM64 remains unmeasured.
Newer streaming library — separate macOS AOT series
A follow-up uses newer managed HTTP fixtures. It changes only the root observer within each pair and validates another 768 responses, including 480 timed requests.
| Workload | Baseline requests/s (range) | Candidate requests/s (range) | Median change |
|---|---|---|---|
| Plain text | 79.30 (72.98–80.10) | 101.11 (86.99–102.76) | +27.5% |
| Object JSON | 40.93 (36.91–41.05) | 53.36 (48.79–53.67) | +30.4% |
This series qualifies AOT only; it makes no additional JIT claim. Immutable raw results.
How these runs are measured
Each worker receives 32 sequential HTTP/1.1 requests over fresh loopback connections, with connection close after each response. The first eight requests are excluded from timing. Each variant has a separate warmup process before five alternating measured rounds. Client wall time includes receiving and validating the response; build, process startup and JIT compilation are outside request timing. Profiling is disabled during throughput measurements.
These short, concurrency-one runs do not measure saturation, sustained service capacity or parity with .NET and Go. Raw reports retain commands, source/input hashes, individual timings and startup measurements. Reproduction instructions and exact fixture constraints are in the experiment record.
Correctness and allocation diagnostics
Separate instrumented macOS runs report complete final reclamation and zero collector failures. These counts cover entire processes, including setup and shutdown; they are not allocations per request or total operating-system memory consumption.
| Guest fixture | Plain allocations / reclaimed | JSON allocations / reclaimed | Peak arena extent, plain / JSON |
|---|---|---|---|
| Fixed fixtures | 17,908 / 17,908 | 40,214 / 40,214 | 13,584 / 19,640 bytes |
| Newer streaming fixtures | 16,340 / 16,340 | 38,358 / 38,358 | 13,216 / 19,672 bytes |
These are separate fixture series, not an isolated allocation-reduction comparison. Root/lifetime tests also cover suspended work, abandoned operations and invalid root descriptors. Windows passes collector, admission, profiling and root-rejection checks. Passing these checks supports correctness for the tested scenarios; it does not prove every lifetime path is correct. The experiment record links the raw profiles and checks. GC pause distributions and Windows allocation-per-request measurements are not yet presented as a comparable benchmark series.
Development: dense collection refinement
A 2026-10-14 macOS ARM64 comparison reuses validated heap spans when building the larger native GC lookup table. Seven alternating pairs with longer timing intervals show 2.1–3.3% higher collection throughput on dense object graphs; small/sparse controls are within 1%. Windows paired results improve 3.6–6.9% on dense cases. Both platforms pass correctness checks; noisy hosted macOS results are retained separately. Full validation and collection policy remain unchanged. This is a collection-only result, not an HTTP speedup. The accompanying HTTP regression check validates 768 responses with overlapping timing ranges. Methodology, correctness checks and raw results are retained separately from published release benchmarks.
Development: Serve root validation and repeat
The native root-marker search optimization preserves live descriptor checks and root lifetimes. Its clean 400/sec comparison uses 6.5% less CPU per timed completion; no higher reliable sustained rate was established. Optimization and safety evidence.
A later repeat holds the Serve application object fixed and relinks current native GC adapters. Both 30-second 300/sec trials pass; both 400/sec trials fail, with the second also affected by large generator scheduling delays. Separate wall sampling still places allocation, indexed collection and stack-root publication ahead of string-marker searches. Sampling changes timing, so its request results are excluded from capacity qualification. These are HTTP workload observations, not standalone collector throughput or pause-distribution measurements. Matched Go controls, full results and profile.
Development: bounded intern seeding
The native collector now gathers up to 32 intern entries during its existing header validation pass. Clean heaps seed those entries directly; stale marks or overflow retain the full reset/seed walk. It adds bounded stack scratch space and preserves all validation and root-lifetime checks. All 46 native GC/root tests pass, including sparse/dense heaps, stale marks and the 32/33-entry boundary.
Five alternating collection-only pairs on macOS ARM64 show 12–27% higher throughput on the existing graph matrix. Dedicated two-intern cases improve 6.5–16.5%; a 33-intern overflow case is about 3% slower. These results expose the fallback cost rather than claiming every heap improves. The shared native JIT/AOT collector changes; interpreter collection and default GC policy do not.
A matched Serve pair at 400 offered requests/sec uses about 4% less CPU per timed completion. Scheduling noise and admission misses across repeats prevent a higher reliable sustained-rate claim. Implementation, tradeoffs, safety tests and all results.
What the results guide
The matched wait experiment above separates a large Windows waiting cost from collector work. Collection-pressure changes still need complete temporary-root coverage first: an earlier pacing experiment was rejected because it could fault on an allocation accepted by the existing collector. Generational or concurrent collection remains a design option, not an implemented result.
Dated runs, including slower samples, remain in benchmark history. New workloads or measurement conditions form separate series; results are not silently replaced when performance changes.
Development follow-up: simpler store lookup
A 2026-10-25 interleaved experiment removes the concurrent store adapter’s recent range cache and uses its existing allocation index directly. With the same concurrent pacing, plaintext/JSON throughput increases 2.7%/3.1% and CPU falls 2.7%/2.5% across 82,240 validated responses. Allocation-heavy standalone samples show larger CPU reductions of 8–10%; compute and reusable-buffer work stay within 1%. This compares concurrent GC with its previous policy, not with sync GC.
Managed JIT validates another 1,024 responses. Isolated-owner runs validate 520,953
responses with about 2.0%/1.6% less CPU per response at one/four owners; four-owner
throughput varies and requires longer measurement. This remains an opt-in
experiment (gc-suite/run.py ... --index-only), not a runtime-default change.
Separate paired profiling finds matching p99 GC-pause buckets (65.5–131.1 µs), but a higher observed JSON maximum for the candidate. No pause improvement is claimed. Benchmark throughput and diagnostic pause measurements remain separate.
A longer four-owner comparison (three 15-second windows per policy, 1,016,237 validated responses) narrows the index-only advantage to 0.5% throughput and 1.1% CPU. This supports modest CPU savings, not a large capacity gain.
These connection-close measurements are not directly comparable with TechEmpower Round 23. Its plaintext specification uses pipelining; neoCLR’s current response encoder closes each exchange’s connection. Private read-ahead and input-session ownership now pass interpreter and sync/concurrent AOT/JIT checks, including 128 successive request messages and consumed/unread body boundaries. A private session-aware sender also passes 30 checked real-wire responses across those modes, including pipelined/sequential requests and consumed/unread POST bodies. An internal bounded driver additionally passes 55 wire responses across these modes, including idle-client admission, a two-handler limit and idle-read shutdown. Public Accept/Serve still closes each exchange; public enablement and the refreshed Interpreter/JIT/AOT collector benchmark matrix remain pending.
Fresh execution-mode comparison (development)
The new standalone cohort runs the same six workloads under synchronous/concurrent AOT and JIT, with three rounds per cell. All 72 checksums pass and corresponding allocation counts/bytes match. Median invocation CPU in milliseconds:
| Sample | AOT sync | AOT concurrent | JIT sync | JIT concurrent |
|---|---|---|---|---|
| compute | 64.74 | 64.69 | 64.87 | 64.53 |
| reuse-buffer | 18.04 | 111.19 | 19.20 | 111.78 |
| steady | 98.23 | 151.80 | 200.41 | 256.33 |
| bursts | 55.49 | 82.88 | 105.38 | 133.23 |
| retained-window | 222.62 | 327.09 | 390.20 | 525.50 |
| mixed-phases | 106.62 | 156.70 | 205.43 | 257.79 |
JIT compilation/startup is excluded and recorded separately. These results identify an allocation-heavy JIT cost present with either collector, while the low-allocation reuse case still exposes concurrent store/runtime overhead. They do not demonstrate a concurrent-over-sync advantage. Interpreter exposes only mark-sweep today; its first full-work pass completes compute, reusable-buffer, steady and burst samples. Retained-window times out after 900 seconds, and mixed-phases is not reached. This is an incomplete single-pass cohort, not three-round statistics. Refreshed plain/JSON HTTP qualification now passes 600 responses across 30 close/keep-alive/ pipelined cells. Repeated HTTP measurements are below; pause and worker scheduling profiles remain pending.
Fresh HTTP matrix (development)
Three rounds across the five supported execution/collector combinations and three connection patterns pass 297,504 plaintext/JSON responses. Single-owner native median requests/second:
| Payload / connection | AOT sync | AOT concurrent | JIT sync | JIT concurrent |
|---|---|---|---|---|
| Plain / close | 5,344 | 4,090 | 3,205 | 2,647 |
| Plain / keep-alive | 6,328 | 5,134 | 3,707 | 3,346 |
| Plain / pipeline | 7,395 | 6,038 | 4,432 | 3,749 |
| JSON / close | 3,555 | 2,819 | 2,165 | 1,822 |
| JSON / keep-alive | 3,809 | 3,254 | 2,321 | 2,094 |
| JSON / pipeline | 4,117 | 3,540 | 2,484 | 2,216 |
These private-driver loopback results show reduced HTTP work through reuse and pipelining; they establish neither saturation nor a concurrent-over-sync advantage. Native runs use 4,096 measured requests plus 16 warmup, four clients and depth-16 pipelining. Interpreter runs use 64 measured requests plus 16 warmup and only its mark-sweep collector. Compilation is excluded from native throughput timing. Worker scaling, scheduling contention and GC pause profiles are separate work; public connection policy and collector defaults remain unchanged.
Worker scheduling experiment (development)
Separate shared-heap profiling found thousands of allocation-service round trips under an already exclusive execution lease. An opt-in requester-local allocation path preserves collection ownership, pressure handling and root safety while removing those handoffs. Matched-source four-worker lifecycle tests reduce concurrent elapsed time about 70% and CPU 61%; sync improves too. Sanitized correctness and negative controls pass. This is a shared-pool scheduling result, not an HTTP gain, virtual-thread implementation or promotion of concurrent GC to default.
Separate fiber diagnostics validate 16,640 HTTP responses across AOT/JIT and both native collectors. Raw carrier transfer accounts for roughly 1–5.5% of instrumented invocation CPU; pipelining cuts transfer count about 60%. These measurements include clock overhead and exclude surrounding root and queue work. They support examining handoff frequency and resumption bookkeeping before replacing the carrier, without establishing a precise task-switch cost or a virtual-thread requirement.
Additional scheduling attribution (development)
Sixteen plain/JSON native HTTP profiles pass 16,640 responses across AOT/JIT and both collectors. Root parking and resume preparation/cleanup account for about 0.4–1.9% of invocation CPU, including diagnostic clock overhead. Scheduler acquisition costs more but includes idle GC; that internal split remains under investigation. These are attribution profiles, not new throughput benchmarks or a collector-default qualification.
A further 16-case profile separates acquisition: native polling consumes roughly 7.5–15.3 ms owner CPU per invocation, versus 0.03–1.19 ms for idle GC. All 16,640 responses pass. Idle collection here is only one collection trigger; these numbers do not measure total GC CPU. The next optimization targets repeated scalar-store admission identified in the standalone workload matrix.
Typed scalar stores (experimental concurrent candidate)
A matched 84-invocation AOT comparison preserves all six standard sample outputs and allocation counts. Concurrent reuse-buffer CPU falls from 114.5 to 56.7 ms (50.5%) by admitting a primitive element and its initialization marker together. Its 14 allocations, 555 allocated bytes and 1,016-byte peak arena are unchanged. Other sample median CPU changes are below 0.3%. Native safety checks and expanded AOT/JIT scalar-type tests pass. This is a same-collector gain, not concurrent-default qualification.
The full JIT follow-up passes 48 invocations with exact output and allocation work matching AOT. Reuse-buffer CPU falls 52.8%, from 114.1 to 53.9 ms. Other effects are small and mixed: compute is 2.4% slower in this short cohort. Compilation and metadata loading are recorded separately from invocation CPU. The optimization is now integrated within the private concurrent candidate, with an explicit generic control for comparisons; ordinary hosting continues to use synchronous GC.
Fresh HTTP correctness qualification now passes 2,880 responses across 36 cells: plain/JSON, close/keep-alive/pipeline, and sync/concurrent-control/scalar-candidate AOT/JIT. There are 598 completed concurrent epochs; paired allocation work matches. Two additional JIT cases verify benchmark flag isolation. Repeated HTTP throughput, CPU and pause measurements follow below; qualification timings are not a gain claim.
Repeated HTTP comparison and release direction
The scalar-store follow-up passes 296,064 responses across 72 native invocations and 32,174 concurrent epochs. HTTP effects are small and mixed: plain close JIT shows 5.7% higher CPU and 3.5% lower throughput for the candidate in this cohort. Sync remains faster in all measured configurations. The large standalone buffer-reuse benefit should not be presented as a general HTTP gain.
| Plain text | Sync AOT | Concurrent control AOT | Scalar candidate AOT |
|---|---|---|---|
| Close, requests/s | 5,388 | 4,115 | 4,198 |
| Pipeline, requests/s | 7,539 | 6,124 | 6,174 |
Separate pipeline profiles pass 12,480 responses. Concurrent has fewer measured outer GC operations and lower aggregate owner-operation wall time here, but its p99 bucket is 65.536–131.072 microseconds versus 16.384–32.768 for most sync cases (JSON JIT sync: 32.768–65.536). These are diagnostic operation durations, not request latency or background collector CPU. One run per cell does not establish a stable tail comparison. Synchronous GC remains the default for release preparation while runtime improvements and concurrent experiments continue.
Shared JIT correctness follow-up
An intermittent macOS ARM64 stack-transfer failure was traced to missing explicit instruction-cache publication. The shared JIT memory provider now performs the platform operation before exposing compiled code. This strengthens ordinary and concurrent JIT qualification; it is a correctness fix, not a new throughput claim.
The qualified complete-caller stack proofs and immutable-byref policy are now integrated into the private concurrent backend. Standard HTTP qualification selects that policy explicitly. This preserves the earlier candidate's scoped results; it does not enable concurrent GC in ordinary hosting or admit moving/shared heaps.
The native candidate sources now live under the runtime, with a checked owned-heap configuration. Source generation and compilation no longer require benchmark files. Historical experiments forward to those sources; ordinary hosting and the public collector selection remain unchanged. This is integration evidence, not a new throughput result.
Current integrated stack profiling (development, 2026-10-25) validates 262,272 plain/JSON responses across synchronous/concurrent JIT/AOT. Native stack checks, frame entry, root publication and TLS remain visible in both collectors; concurrent store/index work also remains. These diagnostic captures are not new throughput results or CPU percentages, and do not change the synchronous default.
An opt-in small-frame descriptor-validation split (development, 2026-10-25) reduces concurrent AOT HTTP CPU about 1.6% in a three-round screen and roughly 4–6% in four allocation-heavy standalone patterns. Compute/reuse effects are near flat; buffer reuse is 0.26% slower. All validation checks remain, and matched standalone allocation work is unchanged. Sync also improves and remains faster. JIT timing follow-up passes 98,688 HTTP responses and 48 standalone invocations: concurrent HTTP CPU improves 1.2% for plain and 0.18% for JSON; standalone effects are mixed, with retained-window 2.35% faster and the others between 0.49% faster and 0.67% slower. The switch stays opt-in. These short cohorts do not establish statistical significance or a new default.
Current JIT placement experiment
Development measurements on 2026-10-25 pair system allocation with a 64 MiB contiguous JIT code/static-data reservation. Three interleaved rounds validate 98,688 plain/JSON responses with identical native hosts and collector settings.
| Handler | GC | System requests/s | Arena requests/s | Invocation CPU change |
|---|---|---|---|---|
| Plain | Sync | 4,344 | 7,398 | −41.2% |
| Plain | Concurrent | 3,762 | 5,672 | −33.2% |
| JSON | Sync | 2,454 | 3,714 | −34.0% |
| JSON | Concurrent | 2,219 | 3,190 | −30.2% |
This is a shared runtime-placement improvement in these short loopback cohorts; sync still leads. Managed allocation work matches, but this does not measure native resident memory or isolate instruction/data cache effects. Both providers retain instruction-cache publication and pass 200 active compiler tests. The arena remains test-only: large-image, native-memory and additional-platform qualification is still required. No collector or JIT placement default changes.
The matched standalone JIT cohort passes 48 invocations across six workloads. Concurrent CPU falls roughly 32–35% in steady allocation, bursts, retained-window and mixed phases, 4.24% in buffer reuse, and is effectively unchanged in compute (+0.04%). Managed allocation counts/bytes match. Native-memory and large-image policy remain prerequisites to enabling this outside the test runner.
A subsequent test-only fallback policy retains already published arena code/data and uses system allocation after reservation or allocation failure. Each provider configuration passes 203 active compiler tests; HTTP qualification passes 640 responses. Direct spill tests cover mixed-provider publication and cleanup. Native memory and fallback-policy performance still need measurement; this is safety evidence, not an additional speedup or a change of default.
Fallback-policy follow-up validates another 49,344 timed responses and preserves the concurrent CPU improvement (32.9% plaintext, 30.3% JSON). A separate 8,320-response profile finds roughly 960–1,098 MiB whole-process RSS in these JIT test hosts; fallback is 6.9–31.4 MiB higher in the individual cases. These snapshots include compilation state, metadata and libraries and are not isolated GC/JIT allocation or peak memory. They motivate a compilation-lifetime audit before production placement promotion.
The subsequent compilation-lifetime change releases unused compilation and selection inputs before managed JIT invocation, while retaining executable and native-host ownership. It passes 203 compiler tests, 48 standalone invocations and 57,664 HTTP responses. Separate snapshots show about 57–62 MiB less RSS with sync and 0–13 MiB with concurrent GC. Invocation timings are mixed: concurrent plain HTTP CPU −1.14%, JSON +2.00%, standalone −0.34% to +1.26%. This is runtime lifetime cleanup, not a collector throughput claim. Native allocation versus resident-page attribution remains open; collector and placement defaults are unchanged.
A follow-up allocator profile passes another 8,320 responses and confirms that early release removes about 189.6 MiB of live native malloc storage. It leaves roughly 11–14 MiB before invocation and 3.5 MiB after cleanup. Allocator reservation remains much larger and RSS varies; one released sync case has higher RSS than its control. This explains why live-data cleanup and resident-memory reduction must be measured separately. It does not identify a managed-heap leak or establish a GC speedup.
An opt-in macOS ARM64 stack-bound layout reduces two TLS lookups to one while preserving current bounds, reserve limits, reset and thread isolation. Matched AOT/JIT cohorts pass 148,032 responses plus 60 standalone runs. Concurrent HTTP invocation CPU improves about 1–3.4% in AOT and 1.2–4.5% in JIT, but AOT JSON wall throughput and standalone reuse regress slightly. This remains a shared-runtime candidate, not a default change or a broad concurrent-GC advantage. JIT compilation still occurs synchronously before execution; concurrent GC can run alongside the resulting application code.
A longer composition study combines grouped stack bounds with small-frame storage validation. It passes 590,400 timed HTTP responses and 60 standalone invocations. Concurrent invocation CPU falls 2.4–3.0% in AOT and 4.8–6.6% in JIT; allocation-heavy standalone patterns improve 3.8–6.4%, while reuse-buffer stays flat. Sync also improves and remains faster. A separate 32,896-response profile finds unchanged owner-GC p99 buckets, still longer for concurrent. These results support a bounded macOS ARM64 runtime integration next; they do not change the default collector or establish an industry throughput ranking.